
Property
| Name |
|---|
| Data |
| Diameter |
| Thickness |
| Gap |
| SliceCornerRadius |
| CenterLabel |
| ShowLegend |
| Progress |
Example
xml
<dev:DonutChart x:Name="Chart"
                Diameter="220"
                Thickness="28"
                CenterLabel="Total" />
csharp
Chart.Data = new List<DonutChartDatum>
{
    new("Design", 40),
    new("Development", 85),
    new("Marketing", 25),
    new("Support", 50, Colors.Orange)
};
NOTE
Data can be any IEnumerable<DonutChartDatum>. If it implements INotifyCollectionChanged (for example ObservableCollection<DonutChartDatum>), the chart rebuilds automatically when items are added or removed.
NOTE
If DonutChartDatum.Color is not set, a color from the built-in palette is used.
WARNING
Negative values are treated as 0.
WARNING
Gap is an angle in radians, not pixels.
WARNING
Progress (0 to 1) drives the sweep animation and is reset every time the data changes. It is not intended to be set manually.
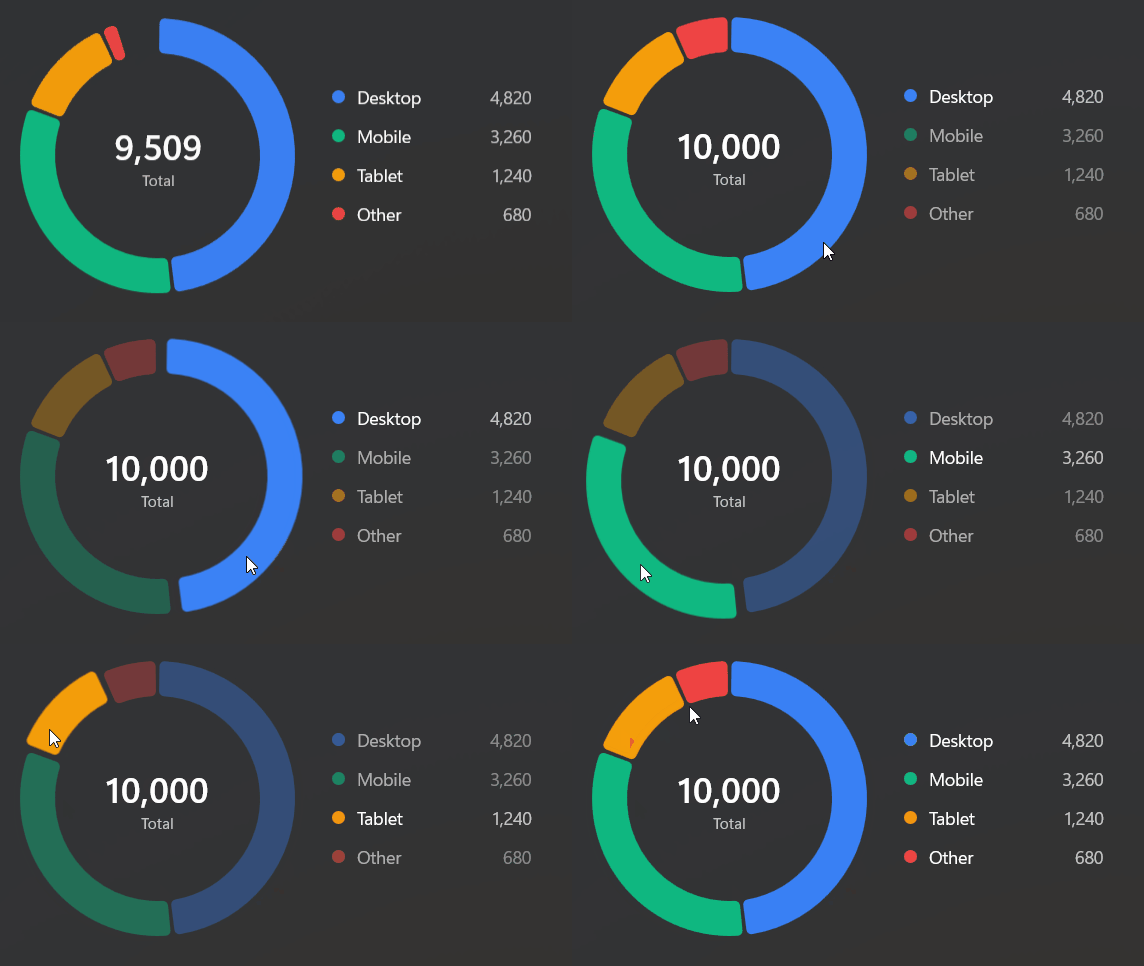
Demo
you can run demo and see this feature.